| Key Points | Details to Remember |
|---|---|
| 🏃♂️ Definition | Regular recording of sessions and sports indicators |
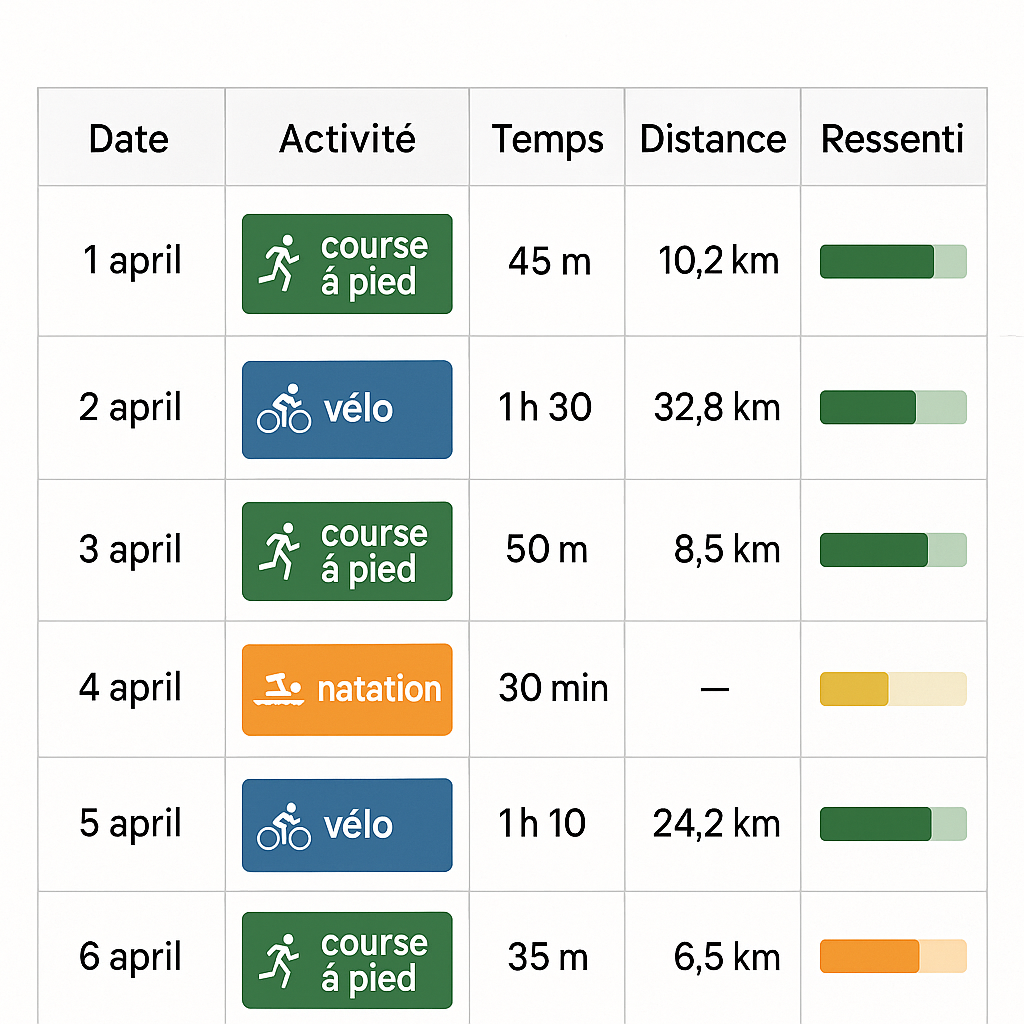
| 📈 Structure | Clear columns for date, activity, duration, distance, feeling |
| 🧮 Formulas | SOMME.SI.ENS to total under conditions, NB.SI.ENS to count |
| 📊 Analysis | Charts (curve, box plot) to track progress |
| ⚙️ Tips | Conditional formatting and freezing panes for better readability |
Tracking your sports performance is not just a matter of motivation: it is also a tool to adjust your training and avoid stagnation. In this article, I guide you step by step to create a sports tracking table in Excel, from setting up the columns to detailed analysis of your data. Whatever your discipline (running, cycling, swimming, weight training…), the idea remains the same: record each session and extract the most relevant lessons.
Why create a sports tracking table?
When I started my first half-marathon, I tended to forget my interval times or how I felt that day. Result: I often repeated the same sessions until exhaustion. With a tracking table, I was able to visualize progress, spot dips in form, and even anticipate injuries.
Beyond the chronological aspect, this digital logbook offers an overview of:
- Your weekly and monthly performances
- The consistency of your training
- The link between intensity and recovery
In short, it is a true virtual coach that asks for a bit of discipline at the start to save you much more later.
Steps to create the table
1. Define the key indicators
Before opening Excel, ask yourself these questions: what data do you want to record? The most common are date, activity (running, cycling, swimming…), duration, distance or weight lifted, and feeling (scale from 1 to 10). If you practice several sports, a “Type” column will help you filter data quickly.
2. Structure the file
The organization of tabs is just as important. You can:
- Keep a “Raw Data” tab for each session.
- Add a “Monthly Summary” tab to automatically compile totals and averages.
- Create a “Charts” tab dedicated to visuals.
In the top bar, don’t hesitate to merge and split cells correctly to get a clear and airy header.
3. Enter and format the data
Start by creating the columns:
Date | Type | Duration (min) | Distance (km) | Feeling
Then, apply a date format to the first column and use conditional formatting on the feeling cells to quickly spot difficult days (red for ≤ 4, green for ≥ 8). This visual touch makes reading easier as the table grows.
Analyze your data
Raw numbers are good, but trends are better. Here are three analysis techniques:
Evolution curve
Plot a simple curve of your distance or duration over time. Select your data and create a line chart: you will see at a glance if you are progressing.
Box and whisker chart
To analyze the distribution of your interval or recovery times, a box and whisker chart reveals median, quartiles, and extreme values. It is ideal for assessing the consistency of your performances.
Pivot tables
If you practice several sports, a pivot table can summarize the total distance per month or the number of sessions by type. And to go further, you can make your pivot tables interactive with slicers: select a sport, a period, or a feeling, and the report updates instantly.
Essential formulas
Conditional functions are your allies to automate totals:
- SUMIFS to calculate the total distance of a given sport over a defined period.
- COUNTIFS to count the number of sessions where the feeling was greater than 7.
- The IF function to create indicators such as “Good session” or “Difficult session”.
By combining these formulas, you get a dynamic summary of your performances without having to update each figure manually.
Tips and best practices
- Freeze panes: keep the header visible when scrolling through the table.
- Conditional formatting: color cells according to thresholds to instantly visualize records or lows.
- Comments: add notes about the weather or your condition that day to contextualize your data.
With these small practices, your table remains always readable and motivating, even after several months of training.
FAQ
- How to automate adding a new row for each session?
- You can convert your data range into an Excel Table (Ctrl+T): with each entry below the last row, formatting and formulas propagate automatically.
- Can I track multiple athletes in the same file?
- Yes, by adding a “First name” or “Identifier” column and filtering via a pivot table or the Filter function.
- Which formula to calculate average speed?
- Simply divide the distance by the duration (in hours):
=Distance/(Durée/60)to get a pace in km/h.


