Slow server: understanding the causes and optimizing it to regain performance
A slow server is never slow “for no reason”: it often lacks resources, handles too many requests at the same time, or gets blocked by a bottleneck in the application, the database, or the disk. In practice, the right approach is to diagnose before acting, otherwise you only mask the symptoms.
The goal of this guide is simple: to help you identify the real cause, distinguish what comes from the server, the network, or the code, then apply the most effective fixes, in the right order. The icing on the cake: you will avoid “false good ideas” that waste time, like blindly restarting or adding resources without measuring the real effect.
In brief
⚡ A slow server often comes from a classic trio: saturated CPU, insufficient memory, or disk under pressure.
🔍 The right reflex: first measure the server response time, then isolate the bottleneck instead of tinkering randomly.
🧩 A slow database or a poorly configured server cache can cripple a machine that looks fine on paper.
🚀 The most cost-effective optimizations are often simple: clean up, limit unnecessary processes, fix heavy queries, and monitor over time.
How to recognize when a server is really slow?
The short answer: a server is really slow when its response times increase, requests pile up, and the degradation recurs, even on simple tests. Before talking about optimization, you need to verify that the slowness really comes from the infrastructure, and not from a browser, an external network, or a temporary spike on the application side.
The most common symptoms
In practice, warning signs are not always spectacular. You mostly see delays that gradually lengthen, then occasional blockages. That’s why it’s useful to follow concrete indicators rather than rely on a general impression.
- High response time on pages, APIs, or services.
- Requests accumulating in queues.
- Disconnections, 502/504 errors or intermittent timeouts.
- Slowdowns at certain times, often during traffic peaks.
- CPU or RAM load that remains high for a prolonged period.
Distinguishing server, network, and application
It should be noted that slowness does not automatically mean the machine is poorly sized. An unstable network, an overly costly SQL query, or a missing cache can give exactly the same user experience. Hence the interest of a structured slow server diagnosis.
| Observed symptom | Probable cause | First check | Quick action |
|---|---|---|---|
| Overall slow loading | CPU, RAM, or disk saturated | System resource usage | Reduce load, stop unnecessary processes |
| Pages that respond then block | Slow database or application queue | Slow queries, application logs | Optimize queries, enable cache |
| Irregular slowdowns | Traffic spike or temporary saturation | Peak hours, number of connections | Limit concurrency, monitor load increase |
| Unstable response time | Under-dimensioned network or hosting | Latency, losses, availability | Check network link and hosting capacity |
A server is not “slow by nature”: it becomes slow when a single component slows down everything else.
The main causes of a slow server
Once the symptoms are identified, you need to trace back to the root cause. In most cases, the performance failure comes from a saturated resource, a shaky configuration, or an overly heavy application process. In other words, the machine may be healthy but poorly used.
Insufficient resources
The classic trio is CPU, RAM, and storage. A saturated processor lengthens queues, too little RAM pushes to disk swapping, and slow or nearly full storage slows down the entire system. This means the problem can come from the simplest link, not necessarily the most visible one.
- Saturated CPU: too many simultaneous calculations, compression, image processing, heavy scripts.
- Insufficient memory: frequent swapping, processes competing with each other.
- Disk too slow or nearly full: pending I/O, large logs, cramped database.
Configuration or load issues
A server can also become slow because it runs too many services with poorly adjusted settings. This is common after an update, adding a module, or a traffic increase. In this case, the system is not “broken,” it is just overloaded.
Application bottlenecks
Inefficient database queries often cause more damage than a slight hardware performance drop. Without indexes, without cache, or with overly heavy background processes, the application consumes resources for nothing. Here, optimizing a server also involves the code and the data.
Restarting can bring some relief, but it does not fix a slow query, a poorly designed cache, or a badly indexed database.
External factors
Finally, external causes should not be underestimated: traffic spikes, undersized hosting, network latency, backups running at the wrong time. A server may seem “faulty” while it is just experiencing an unusual load. Hence the importance of server monitoring to read the context, not just the failure.
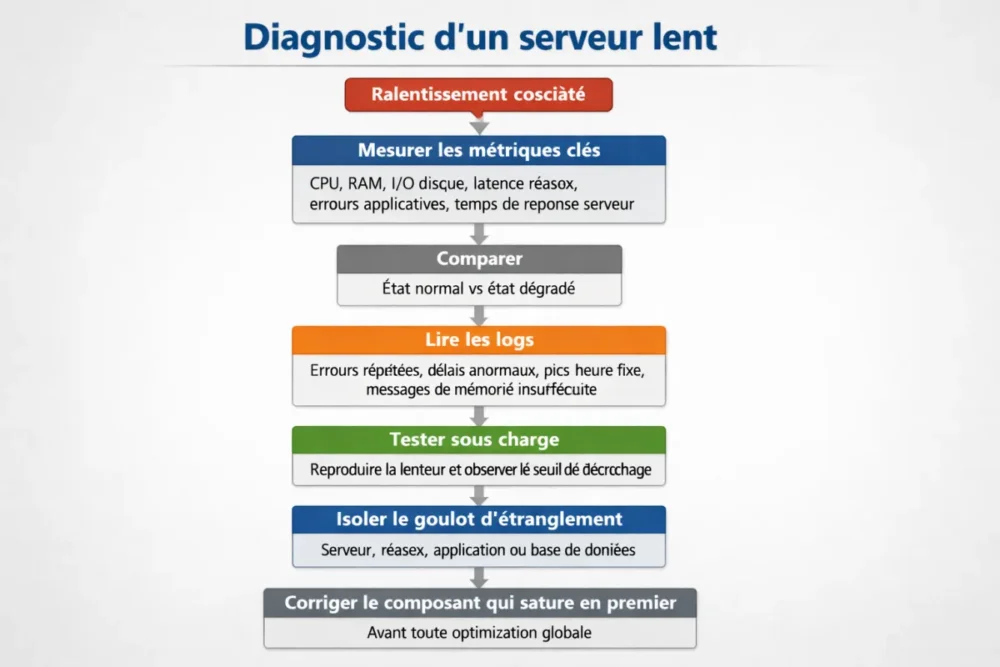
Diagnosing slowness step by step?
The best approach is to follow a simple logic: measure, compare, isolate. If you try to fix without prioritizing symptoms, you risk wasting time and addressing the wrong area. A good slow server diagnosis starts with some stable metrics, then moves on to logs and actual load.
Measure the right metrics
The priority indicators are well known: CPU, RAM, disk I/O, network latency, application errors, and server response time. If you measure only one point, you see a symptom. If you track several in parallel, you begin to understand the real mechanism.
- Record system load at the time of slowdowns.
- Compare the normal state and the degraded state.
- Identify the component that saturates first.
- Check if the saturation is constant or linked to a peak.
Read the logs and spot anomalies
Logs are often more talkative than one might think. Repeated errors, abnormal response delays, activity spikes at fixed times, insufficient memory messages: all this outlines a trajectory. In other words, logs do not give the final solution, but they quickly guide you to the right layer of the stack.
Test the load and isolate the problem
When possible, you should reproduce the slowness in a controlled environment. Load testing allows you to see from which threshold the system fails. This is particularly useful after an update, a configuration change, or a sudden traffic surge.
How to quickly optimize a slow server?
The short answer: start with reversible, measurable, and high-impact actions. The idea is not to rewrite everything, but to remove the most obvious bottlenecks. A slow server can often regain a lot of fluidity with a few targeted fixes, provided you keep an eye on the metrics after each change.
Immediate high-impact actions
Before touching the architecture, address the emergencies. Disk saturation, an unnecessary process queue, or a failing cache can create a domino effect. The most effective fixes are often the simplest, as long as they are done properly.
- Free up unnecessary resources: zombie processes, superfluous services, duplicate tasks.
- Resolve disk saturation: clean, archive, move large files.
- Reduce memory pressure: lighten services, check for leaks, limit spikes.
- Improve server cache: reduce recalculations and repeated reads.
Optimize the database and the application
When the database slows down, everything else follows. Optimization then involves cleaner queries, relevant indexes, and removing unnecessary calls. It is always advisable to test each modification on a non-critical environment before generalizing it: this way, you avoid replacing one problem with another.
- Reduce costly queries and unnecessary joins.
- Create or fix indexes on the columns actually filtered.
- Limit repetitive calls in loops or heavily used pages.
- Clean up background processes that consume too many resources.
Adjust system configuration
A poorly configured server can lose a lot of performance without being “full.” You then need to review connection limits, service parameters, allowed concurrency, and scheduled tasks. Here, the golden rule is simple: change one thing at a time, then measure the effect. Without measurement, no real diagnosis.
Long-lasting optimizations to prevent slowness from returning
Good optimization is useless if slowness returns two days later. To last over time, you need to monitor, document, and standardize. It’s less flashy than a quick fix, but infinitely more profitable in the long run.
Set up continuous monitoring
Server monitoring allows you to track trends before performance breakdowns. By keeping a history of resources, response times, and errors, you spot drifts before they become visible to users. It’s the best way to anticipate rather than endure.
Properly size the infrastructure
At some point, software optimization reaches its limits. If traffic increases steadily, if the disk remains saturated despite cleaning, or if the CPU is constantly maxed out, you need to consider scaling up. This can involve more memory, faster storage, or a better-distributed architecture.
Standardize maintenance
Servers like regularity. Controlled updates, periodic cleaning, log checks, testing after each change: these actions prevent unpleasant surprises. In practice, a small maintenance ritual is better than a big intervention every six months.
When should you consider scaling up?
The right answer: when saturation returns despite serious fixes, and the metrics show a hardware or structural limit. If the server is slow because it is permanently too small for its load, optimization alone will not be enough. You then have to balance cost, risk, and expected gain.
Signs that software optimization is no longer enough
Some signals are very clear: repeated saturation, steady traffic increase, growing queues even after optimization, or worn-out hardware. In this case, it is better to invest in a coherent upgrade than to multiply patches.
Choosing Between Optimization and Upgrade
The right choice depends on three things: the cost of the fix, the expected performance gain, and the acceptable level of risk. If an optimization solves 80% of the problem with little effort, it takes precedence over an upgrade. If the limit is structural, you simply need to scale up.
Errors to Avoid
Bad practices are often the same: confusing the symptom with the cause, changing several parameters at once, ignoring logs, or adding services without real need. The trap is believing that a quick action is necessarily a good action. Not always, far from it.
- Do not diagnose after fixing.
- Do not restart systematically without understanding the origin of the slowness.
- Do not multiply unnecessary services that consume CPU and RAM.
- Do not neglect monitoring after changes.
- Do not apply optimization without before/after measurement.
Key Takeaways
🧭 A slow server is better handled with a method than with assumptions.
🔧 Priority goes to the real bottleneck, not the most visible symptom.
📊 Key metrics remain CPU, RAM, disk I/O, and server response time.
🗃️ A slow database or a poorly configured server cache can slow everything down.
🚦 Server monitoring prevents reliving the same performance failure.
FAQ
Why does my server suddenly become slow?
A sudden slowdown often points to a sudden saturation, a problematic update, a heavy scheduled task, or a database issue. You need to check logs, system load, and traffic spikes during the exact period of the problem. Without this correlation, you are navigating blindly.
How to know if the problem comes from the CPU, RAM, or disk?
The simplest way is to see which indicator rises first when the slowness appears. A very high CPU slows down computation, insufficient RAM triggers swapping, and a slow disk is identified by a high I/O wait. The three can also combine.
Should I restart a slow server?
Only if the diagnosis justifies it. A restart can temporarily relieve saturation, but it does not fix the cause. If you don’t know why the server is slowing down, it’s better to first collect metrics and logs, then act on the real problem.
Can cache really speed up a server?
Yes, often a lot. A good server cache avoids recalculating or rereading the same data repeatedly, which reduces the load on the database and the processor. But a poorly configured cache can also create inconsistencies or hide another problem.
When should server resources be increased?
When optimizations are already in place, but saturation returns constantly. If traffic increases and resources max out despite good tuning, upgrading becomes more rational than a series of micro-fixes. The important thing is to measure the expected gain before deciding.


